What is Gross Margin? A Simple Guide That Actually Makes Sense
Revenue numbers look impressive on paper, but they don't tell you the whole story. What is gross margin? This financial metric shows you something far more important than your top-line sales—it reveals how much money you actually keep from each dollar that comes through your door.
Most business owners get caught up watching their revenue climb, but gross margin exposes what really matters: your actual profitability. This percentage represents how much revenue stays in your business after you pay for the cost of goods sold (COGS). When you see a 75% gross margin, that means 75 cents from every dollar earned remains with your company, while 25 cents went to production costs.
Here's what this number really tells you about your business efficiency: manufacturers with higher gross margins convert raw materials into income more effectively than their competitors. Without a profitable gross margin, you're stuck in an impossible situation—spending more to create your products or services than you earn from selling them. That's not a business model that survives.
A strong gross margin means your company keeps more capital for growth and proves you're managing both production costs and pricing strategies effectively. This guide shows you exactly how gross margin works, how to calculate it correctly, and most importantly, how to use this critical metric to make smarter business decisions.
What is Gross Margin and Why It Matters
Business owners face a common problem: they know their revenue but struggle to understand their actual profitability. Gross margin solves this challenge by showing exactly how efficiently your business converts each sales dollar into profit.
Gross margin meaning in simple terms
Gross margin tells you what percentage of revenue stays in your business after paying for the direct costs of producing goods or services. Think of it this way: if you have a 35% gross margin, you keep $0.35 from every dollar earned while $0.65 covers your production costs.
This percentage reveals something critical about your business operations—how well you balance what you spend on production against what you charge customers. When your gross margin increases, you're either getting better at controlling costs or commanding higher prices. When it decreases, you've got a problem that needs immediate attention.
Why businesses track gross margin
Smart business owners monitor gross margin because it exposes inefficiencies before they become serious problems. This metric gives you instant visibility into whether your production costs are eating away at your profits.
Here's exactly what gross margin tracking accomplishes:
- Long-term planning - Stable margins let you predict how much profit each sales dollar will generate
- Production efficiency evaluation - Falling margins signal developing problems in your operations
- Business expansion decisions - You can't make smart growth choices without knowing your baseline profit per dollar
- Competitive analysis - Industry comparisons show where you stand against competitors
Gross margin works as your financial early warning system. Different industries operate at vastly different margin levels—food businesses average 14.4% while apparel hits 52% and health products reach 58%—but what matters most is whether your margins stay consistent and trend upward.
Gross margin vs gross profit
Many business owners mix up gross margin and gross profit, but these metrics measure profitability in completely different ways.
Gross profit gives you a dollar amount—the actual money left over after subtracting COGS from revenue. If you generate $100,000 in sales with $60,000 in production costs, your gross profit equals $40,000.
Gross margin converts that relationship into a percentage by dividing gross profit by revenue. Using the same numbers, your gross margin would be 40%.
The percentage format makes gross margin more useful because it allows you to:
- Compare performance across different time periods regardless of sales volume
- Evaluate businesses of different sizes within your industry
- Put profit figures in proper context relative to total sales
A $25,000 gross profit tells you nothing without context. That number looks completely different if total sales were $50,000 versus $500,000. Gross margin eliminates this confusion by showing proportional profitability.
Use gross profit for day-to-day cash flow planning and gross margin for strategic decisions and performance analysis.
How to Calculate Gross Margin
Here's exactly what you need to know about calculating gross margin: this simple formula gives you immediate insight into your business performance, but only when you apply it correctly.
Gross margin formula explained
The gross margin formula is: (Revenue - COGS) / Revenue × 100. This calculation shows you how much of each revenue dollar stays in your business after production costs.
Break it down into three steps:
- Subtract your Cost of Goods Sold (COGS) from total revenue
- Divide that result (your gross profit) by total revenue
- Multiply by 100 to get your percentage
Why does this percentage matter more than the dollar amount? While gross profit gives you a fixed number, gross margin shows profitability as a percentage. That percentage lets you compare performance across different time periods, products, or even against competitors—regardless of business size.
Step-by-step gross margin calculation
Getting accurate data is your first priority. Follow these steps to calculate your gross margin properly:
- Calculate total revenue - Multiply quantity sold by selling price (Total Revenue = Quantity × Price). A business selling 100 products at $150 each has $15,000 in total revenue.
- Determine COGS - Add up all direct production costs. This includes raw materials, direct labor, and manufacturing overhead. Don't include indirect expenses like marketing or administrative costs—those come later.
- Calculate gross profit - Subtract COGS from total revenue (Gross Profit = Revenue - COGS). This number represents profit before operating expenses.
- Compute gross margin percentage - Divide gross profit by total revenue and multiply by 100. This percentage reveals how efficiently you convert revenue into profit.
Example of gross margin in action
Take a retail business that generated $10 million in revenue with $8 million in COGS during 2023:
- Calculate gross profit: $10 million - $8 million = $2 million
- Divide gross profit by revenue: $2 million ÷ $10 million = 0.20
- Convert to percentage: 0.20 × 100 = 20%
That 20% gross margin means the business keeps $0.20 from every dollar of revenue, while $0.80 covers production costs.
Consider another example: a manufacturer with $500,000 in annual sales and $300,000 in COGS. Their calculation: (($500,000 - $300,000) ÷ $500,000) × 100 = 40%
The higher percentage shows better efficiency in converting sales to profit. Track this metric consistently—patterns in your gross margin reveal business performance trends you might otherwise miss.
Markup vs Gross Margin: What's the Difference?
Business owners mix up markup and gross margin all the time, and that confusion costs them money. These two financial concepts measure profitability from completely different angles, and knowing the distinction helps you make better pricing decisions and understand what your numbers actually mean.
Understanding markup
Markup shows how much you add to your cost price to reach your selling price. This percentage is based on cost, not revenue. When you mark up a product, you're deciding how much extra to charge beyond what you paid for it.
The markup formula is straightforward: ((Selling Price - Cost) ÷ Cost) × 100. Take a product that costs $50 and sells for $75—your markup calculation becomes: (($75 - $50) ÷ $50) × 100 = 50%. You've added 50% to your cost to set the selling price.
Markup works well for pricing decisions because it ensures specific profit levels per unit sold. But here's where businesses get confused: a 50% markup doesn't equal 50% profit on each sale—that's where gross margin comes into play.
How markup and gross margin relate
Both metrics measure profitability, but they start from different points. Markup focuses on cost (how much above cost you're selling), while gross margin focuses on revenue (what percentage of your selling price becomes profit).
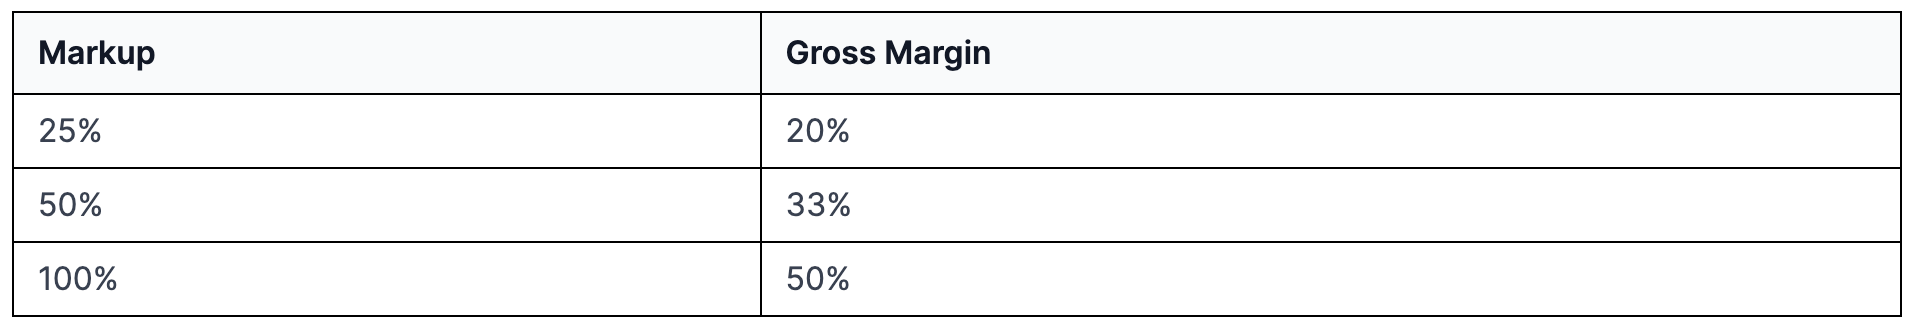
The math creates a consistent pattern: markup percentages always run higher than the equivalent gross margin percentages. The same financial situation produces different numbers depending on which metric you choose:
This explains why profitability conversations sometimes go nowhere—people use different measurements without realizing it.
Converting between markup and gross margin
Getting everyone in your organization to speak the same financial language requires these conversion formulas:
To convert markup to gross margin: Gross Margin = Markup ÷ (1 + Markup)
To convert gross margin to markup: Markup = Gross Margin ÷ (1 - Gross Margin)
A 60% markup converts to a 37.5% gross margin: 0.60 ÷ (1 + 0.60) = 0.375 or 37.5%. A 25% gross margin converts to a 33.3% markup: 0.25 ÷ (1 - 0.25) = 0.333 or 33.3%.
When you're talking with suppliers or production teams, markup often makes more sense. When you're analyzing financial statements or comparing business performance, gross margin provides better insights because it connects directly to revenue percentages.
Using Gross Margin in Business Decisions
Smart business owners don't just calculate gross margin—they use it to drive every major strategic decision. This metric becomes your compass for pricing power and operational strength, revealing exactly where your business stands and what moves to make next.
Setting pricing strategies
When gross margins fall below what your business needs to operate, pricing adjustments become unavoidable. Your margin directly determines whether your business model actually works. Three pricing approaches consistently deliver results:
- Value-based pricing focuses on what customers perceive as worth paying, not what you spent to create it
- Dynamic pricing shifts with market conditions, demand patterns, and competitive pressure
- Premium pricing works when your product quality justifies higher rates
Most businesses haven't evaluated their pricing in months or years. Market conditions change, costs shift, and customer expectations evolve. Regular pricing reviews prevent the slow margin erosion that kills profitability.
Evaluating product profitability
Here's exactly what you need to know about product analysis: gross margin shows you which products actually make money and which ones drain resources. This data drives two critical decisions.
First, identify your high-margin winners for increased marketing investment. Second, spot the underperformers that need immediate improvement or elimination.
A retail business discovered their bestselling products delivered the lowest margins. Instead of celebrating high sales volume, they shifted marketing focus toward value positioning and raised prices on popular items, bringing margins closer to industry standards.
Tracking performance over time
Declining gross margins signal trouble in your production model or supply chain before problems show up elsewhere. Watch for patterns that indicate operational inefficiencies creeping into your business processes.
Margin trends reveal problems early enough to fix them.
Comparing with industry benchmarks
Industry averages provide context for evaluating whether your margins are adequate:
Software (SaaS): 75%-85% Professional Services: 55%-65%
Retail (E-commerce): 30%-45% Manufacturing: 25%-35% Construction: 15%-20%
These differences reflect variations in cost structures, pricing power, competition levels, and business models. An e-commerce retailer operating at 20% margins faces serious problems when industry averages run 30-45%.
Compare your margins only within similar industries. Software companies shouldn't measure against construction businesses—their cost structures bear no resemblance to each other. What constitutes a "good" margin depends entirely on your sector, cost structure, and growth stage.
Gross Margin Tools and Industry Variations
Basic gross margin calculations tell you where you stand today. Advanced metrics show you exactly where to focus your improvement efforts, while industry benchmarks reveal whether your performance meets market standards.
GMROII, GMROS, and GMROL explained
Three specialized metrics help you dig deeper into gross margin performance. GMROII (Gross Margin Return on Inventory Investment) measures how effectively your inventory generates profit by showing how many times you've recovered your inventory investment through gross profit. Retail businesses need a GMROII of at least 3.2 for healthy financial performance.
GMROS (Gross Margin Return on Space) tells you which products deliver the most profit per square foot of retail space. GMROL (Gross Margin Return on Labor) measures profit generated per full-time employee. These metrics help you identify where your resources work hardest and where they're underperforming.
Gross margin by industry: what's normal?
Business models drive margin expectations. Software companies achieve 75-85% margins because their products scale without proportional cost increases. Construction businesses operate at 15-20% margins due to material and labor intensity. Here's what different industries typically see:
- Professional Services: 55-65%
- Healthcare Providers: 45-55%
- Retail (E-commerce): 30-45%
- Manufacturing: 25-35%
- Hospitality: 20-30%
Banking maintains nearly 100% gross margins, while automotive industries struggle with 9-12% margins. These differences reflect each industry's cost structure and pricing power.
How to interpret your margin in context
Your "good" margin depends on specific business factors:
- Cost structure (labor vs. materials vs. technology)
- Market pricing power
- Competition intensity
- Business model (asset-light vs. asset-heavy)
Context matters more than absolute percentages. Comparing your software company's margins to construction industry averages makes no sense. Focus on companies with similar business models and cost structures.
Conclusion
Gross margin isn't just another financial metric to track—it's your business reality check. This single percentage tells you whether your pricing strategy works, whether your production costs are under control, and whether you have a sustainable business model.
The calculation itself takes seconds: gross profit divided by revenue, multiplied by 100. What matters is what you do with that number once you have it.
Your gross margin becomes the foundation for every major business decision you make. When margins are strong, you have options—invest in growth, weather economic downturns, or improve your competitive position. When margins are weak, you're operating on borrowed time until market conditions or competition forces changes you might not be ready for.
Here's exactly what you need to know: track this metric monthly, compare it against your industry benchmarks, and watch for trends over time. A declining margin signals problems that need immediate attention. An improving margin means you're gaining operational efficiency.
Don't get caught up in whether your 30% margin is "good" compared to a software company's 80%. Focus on whether your margin supports your business goals and provides enough cushion for unexpected challenges.
AdaptCFO can help you analyze your gross margin and develop strategies to improve it. Start by understanding where you stand today, then work methodically toward optimizing this vital metric for long-term business success.
If you're looking to get some advice on your finances, book a call with our team here, or get your free Financial Fitness Score here.
Ready to Get Started with AdaptCFO?
We provide the tools to become more skilled at financial literacy. Learn more about our different service levels.
View Pricing